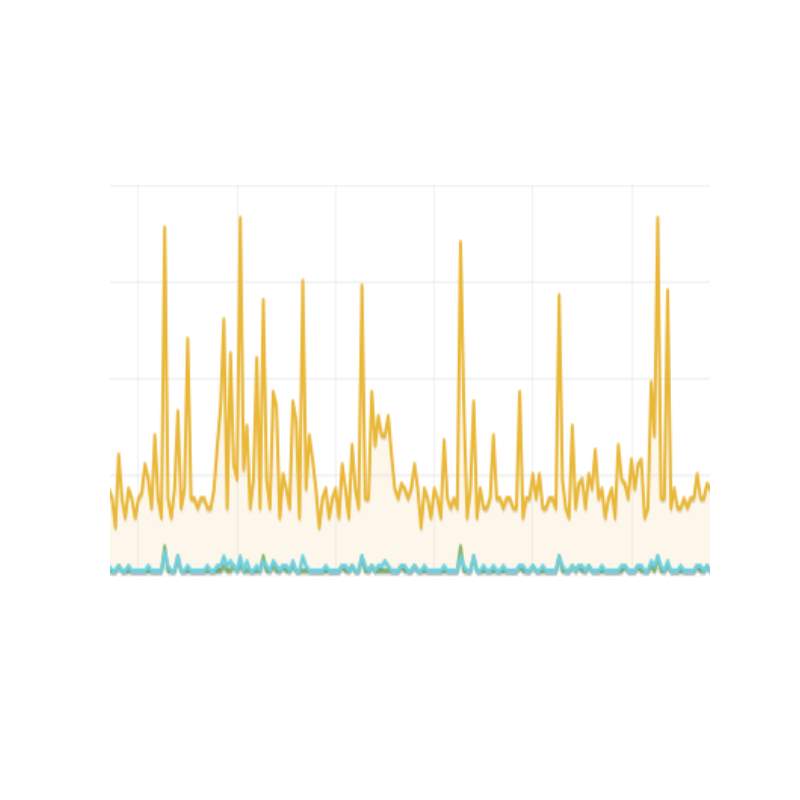
Product description
Monitoring is an integral part of IT resources, without this it is difficult to determine what is happening to your IT infrastructure. By implementing a monitoring system you gain first of all:
- - Awareness of what and when happens to your IT resources,
- - Notifications about all incidents and significant reduction to response time to breakdowns,
- - The collected metrics database is an ideal treasury of knowledge for seeking optimization and savings in IT resources.
- - You are starting to be proactive, you can predict future incidents or needs for new IT resources.
The service for at least one host includes installation and preparation of the system for data collection and installation and preparation of the agent for sending metrics. The most common pairs of installations for monitoring are:
- - Grafana, Influxdb, Telegraf
- - Kibana, Elasticsearch, Logstash
- - Munin, munin-node
- - Icinga, nrpe
- - Logi postgres, pgbadger
- - CloudWatch, CloudWatch Agent
What can be monitored?
- - Basic system metrics (CPU, IOPS...),
- - Network devices, LoT, cameras...
- - Application response time to expected value
- - Database metrics, preview of time to perform queries,
- - Application logs, provided they are in JSON or XML format. parsing of another format is additionally charged,
- - Web server logs such as Apache2, Nginx.
